UWorld QBanks: Essential Tools for Success

9755 Views
“Without data, you’re just another person with an opinion.” These words come from a statistics and business management guru, but they’re equally relevant to medical students. As a professional medical school exam tutor, I help medical students prepare for some of the most important tests of their lives, and my students rely on me to be more than “just another person with an opinion.” They depend on me to be an expert. And for that reason, I must rely on data.
When it comes to the USMLE® exams, specifically, there are many data sources. In this blog post, I discuss one of the largest and most comprehensive sources: the UWorld Step 1 and Step 2 CK QBank performance analysis tools. Using the demo data taken from the UWorld Medical website, I will show you how to navigate these tools and use their features to reach your full potential on test day.
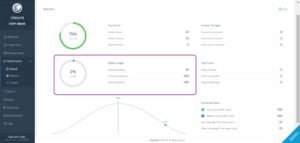
Overall Performance
The first thing I check when I open a student’s performance analysis is the overall performance chart. This chart shows me how the student performed cumulatively on all the questions completed to that point. It breaks them down into three colored segments: green for correct, red for incorrect, and blue for omitted. It also lists the exact number of questions in each category.
![]()
Percentage Correct
The overall score (percentage correct) varies considerably over time. It usually starts with a lot of red as it’s not unusual for students to score in the 20-30% range at the beginning of their dedicated study period. However, the red tends to decrease over time, and the green increases until the scoring display is primarily green. So, the overall score at any point in time is less important than maintaining an acceptable rate of improvement throughout a student’s dedicated study.
Although straightforward enough, this analysis ignores the relevance of the blue segment or the omissions. This segment should always be small. Too many omitted questions indicate a major problem: either the student isn’t making it through all the questions in the allotted time or is not using UWorld properly. This needs to be addressed one way or another.
Answer Changes
Next, I look at answer changes. This table breaks down into three categories how students change their answers: “correct to incorrect,” “incorrect to correct,” and “incorrect to incorrect.”

The most important category here is “correct to incorrect.” Many students tell me they get most questions down to two or three answer choices but frequently pick the wrong one. In most of these cases, I find that students usually know the right answer—they just second-guess themselves. Instead, they should keep an eye on those “correct to incorrect” numbers under the answer changes header. In some cases, if the “correct to incorrect” number is unusually high, this can be one sign—often of many—that the student is struggling with test anxiety. If this seems to describe you, see our post on handling test anxiety in medical school.
When reviewing answer changes, remember that UWorld can detect these errors only when you click from one answer to another. If you’re second-guessing yourself before clicking an answer, UWorld has no way of knowing your thought process, and it won’t show up under answer changes. Therefore, these numbers probably underestimate how frequently you’re making this mistake. That’s why I often have students tally their answer changes for themselves as they review each question block.
Next, there’s “incorrect to correct.” These are like high-density lipoproteins—the one good value in a panel of bad! This category speaks for itself, so I’ll just say that I look for it to increase at first, peak in the middle, and then level off as students improve and start to get questions correct right off the bat.
Lastly, there’s “incorrect to incorrect.” Early on, this category often has the largest number. If a student is randomly guessing, then this is just the most likely outcome, statistically speaking. However, over time, the number of newly answered questions falling into this category should decrease. If it doesn’t, it’s a sign that a student is either not learning content or not retaining it.
QBank Usage
The QBank Usage stats found in the middle of the page help me ensure that my students are on track to complete their desired number of UWorld questions on time.
![]()
At the beginning of a study period, I’ll talk to my students about how many UWorld questions we want to finish by test day (if they have a prolonged dedicated period, we usually shoot for two full passes through the QBank). Then, we divide the desired number of questions by the number of study days to see how many questions they’ll need to do each day. QBank Usage helps us ensure that they stay on track and lets us know when they’re falling behind.
Test Count and Percentile Rank
I don’t monitor test count and percentile rank that closely. There’s nothing wrong with these measures; I just find QBank Usage more informative and comprehensive. I also usually discourage students from focusing too much on percentile rank. Hyper focusing on this section can be tempting because it’s normal to be curious about how you stack up against your peers, but be careful. These statistics can cause high levels of stress, especially for students who hold themselves to very high standards. Remember, exam prep in medical school, whether for USMLE, COMLEX, Shelf Exams, or another test, is much more about competing with yourself than it is about competing with anyone else.
That being said, there is one metric here I do follow: “Your Average Time Spent (Sec)” on the lower right of the screen.
For an entire block of 40 questions, UWorld allots one hour. That’s an average of 90 seconds per question, the same amount of time you receive for each question on Step 1 or Step 2 CK. Over time, I make sure my students approach (and achieve) that pace. If a student consistently struggles to finish blocks in time, I’ll have them practice on much shorter blocks before slowly working their way back up to full blocks.
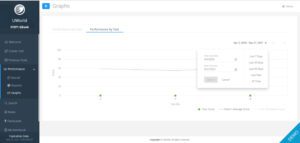
Reports and Graphs
There are two other subsections to UWorld’s Performance Analysis feature: Reports and Graphs.
Under Reports, I can view a student’s performance by subject (anatomy, biochemistry, etc.), system (cardiovascular, gastrointestinal, etc.), or topic (alcohol withdrawal, gluconeogenesis, etc.). I can then customize the results by score, QBank usage, and whichever combination of correct, incorrect, and omitted questions I’m interested in. I can also sort the results by any of these categories.

This helps me quickly identify a student’s areas for improvement in content. In fact, I joke that if we are ever looking for something to discuss during a tutoring session, a quick trip to the Reports tab almost always provides inspiration.
The Graphs tab is good for a global look at a student’s progress over time. It graphs performance by calendar date or question blocks, helping me adjust focus areas during tutoring sessions based upon performance. (There’s also a handy drop-down menu that lets you specify the exact dates to display on the graph!)
All in all, as any of my students can tell you, I’m always an advocate for tailoring your test prep approach to the data. Choosing subjects, systems, or topics to study based only on your overall “gut feelings” on what you think you know and don’t know is a problem. Never be afraid to pull up the data, check how you’re doing, and adjust your study plan to address your problem areas. This is especially true for students who may feel silly or embarrassed about their progress.
As a rule of thumb, if you’re afraid to look at your statistics, it means you should be looking at your statistics! If you put your data to good use, I have no doubt that you’ll quickly see progress or have a clear indicator that it’s time to seek further help.
I wish you the best of luck in your studying journey, and if you ever take a peek at your UWorld statistics and find that you need assistance, don’t hesitate to seek out a tutor.
This post was originally guest posted on the UWorld blog.
Featured Articles