US Doctor Specialties by USMLE Step 2 CK Scores
72121 Views
With the change of the United States Medical Licensing Examination (USMLE) Step 1 transitioning to an entirely pass-fail examination, more emphasis has been placed on the USMLE Step 2 Clinical Knowledge (Step 2 CK) score in the residency selection process.

While your Step 2 score is not the only factor that programs use to evaluate you as a residency applicant, it is one of the most important. This is because it allows program directors to directly compare applicants using a standardized benchmark. Students frequently ask, “What is a good Step 2 score?” First, it is important to recognize that good depends on what specialty you are applying for – some specialties tend to have higher Step 2 scores than others. In this blog post, we review the most recent data on USMLE Step 2 scores and provide some recommendations on what score you should aim for and how to interpret your score. To be fully prepared for this year’s match cycle, we recommend taking a look at our residency application timeline.
Understanding the Differences in the Step 2 Scores by Specialty in 2024
There are varying expectations for USMLE Step 2 scores by specialty, often reflecting the competitiveness of each field. For instance, plastic surgery and dermatology generally require higher Step 2 CK scores, with an average Step 2 score by specialty often around 250. Other highly competitive specialties — like orthopedic surgery and neurosurgery — also fall within this high-score range. These specialties attract applicants who typically achieve higher scores, making them particularly selective and raising the standard for entry.
Fill out the form below to receive your free pre-filled Step 2 excel study planner via email!
On the other end of the spectrum, specialties such as family medicine and psychiatry have a lower average Step 2 score, often around 230. These fields prioritize different aspects of an applicant’s profile, meaning that the average Step 2 score by specialty in 2024 — while important — may not carry the same weight as in more competitive specialties.
For residency matching, understanding score percentiles is essential. The mean Step 2 CK score is around 249, with a minimum passing score of 218. Reaching the 75th percentile can greatly strengthen an application, especially now that Step 1 is pass/fail. It signals above-average clinical knowledge to program directors, thus increasing the chances of interview offers in competitive programs. Achieving a strong Step 2 score for AOA membership (Alpha Omega Alpha Honor Medical Society) further demonstrates academic excellence, a quality highly regarded by competitive specialties.
When considering your specialty, it’s important to recognize that the Step 2 percentile directly influences residency matching. Higher percentiles — notably those above the 75th — correlate with stronger chances in securing preferred residency spots. Considering this, along with average Step 2 score by specialty in 2024, provides a useful benchmark for students aiming to gauge competitiveness in their chosen fields.
Step 2 CK Score Data Set – Charting Outcomes in the Match, 2024
We first took a look at a data set provided by the National Resident Matching Program (NRMP) called Charting Outcomes in the Match, 2024. Specifically, this is a biennial report published by the NRMP which includes data about Senior Students that are from U.S. MD Medical Schools and U.S. DO Medical Schools, and those who are International Medical Graduates (IMGs). In these data sets, you can find information regarding the number of applicants and available positions, match rates, USMLE scores, and applicant characteristics (research, work experience, volunteer experiences, etc.) of recent matching senior medical students. Additionally, the NRMP provides aggregated data of all applicants and also breaks the data down by individual specialties.
It is important to know where this data comes from. Applicant characteristics (USMLE Step 1 and Step 2 scores, academic degrees, publications, Alpha Omega Alpha Honor Medical Society, Research, and Work and Volunteer Experiences) were self-reported. Reporting this data was optional and you can see the consent rates in each of the data sets online. The NRMP validated U.S. MD and DO USMLE Step 1 and Step 2 scores with data reported from medical schools and found high concordance between the student-reported value and values reported by the medical school. Specialties that offered 50 or more positions were included in these reports. This means that most major residency specialties are found in these datasets.
An Important Caveat
This report examines whether a match was made to the specialty of the applicant’s first-ranked program, or “preferred specialty,” because that is assumed to be the specialty of choice. U.S. MD Seniors who match into a specialty not ranked first on the rank order list or who do not match are not included in these analyses.
Similar statements can be in the data sets for IMGs and U.S. DO students. Why are these statements important? When the NRMP does analyses based on each residency specialty (OB/Gyn, Neurosurgery, etc.), they only include students who ranked that specialty first, and ultimately matched into that specialty. For example, if a student ranks a Family Medicine program #1, and then matches into her #4 program, which is also FM, she is included in the analysis for FM. However, if a student ranks an Internal Medicine program #1, but she matches into her #8 program which is a General Surgery program, she is not included in this specialty-specific analysis as this was not her top specialty of choice. So, when reviewing these reports, remember that the data reflects those students who had that specialty as their top choice.
Lastly, it is important to consider what data you DON’T see. The NRMP states that the data used in these reports does not include, “course evaluations, reference letters, and the Medical School Performance Evaluation (MSPE).” You can find more information on the significance of these factors in the 2024 program director’s survey, which can be filtered by specialty. Spoiler alert: they are important.
Step 2 CK Score Data
Let’s first look at all of the applicants together across the three data sets:
| Mean USMLE Step 2 CK for all applicants | ||||
| U.S. MD Seniors | U.S. DO Seniors | U.S. IMGs* | Non-U.S. IMGs* | |
| Matched | 250 | 244 | 236 | 245 |
| Not Matched | 242 | 238 | 226 | 240 |
*An IMG is a student who received a medical degree outside of the U.S. and Canada. Individuals who are U.S. citizens when they graduate from an international medical school are U.S. IMGs while those who are not U.S. citizens are Non-U.S. IMGs. Non-U.S. citizens who graduate from medical school within the U.S. or Canada are not IMGs.
From this data, we can see the trend that those who matched generally have a higher USMLE Step 2 score. This is not too surprising as students with higher Step 2 scores tend to be stronger applicants. We can also observe that U.S. MD Seniors have the highest scores, followed by U.S. DO Seniors and Non-U.S. IMGs, and finally U.S. IMGs.
Data by Applicant Type and Specialty
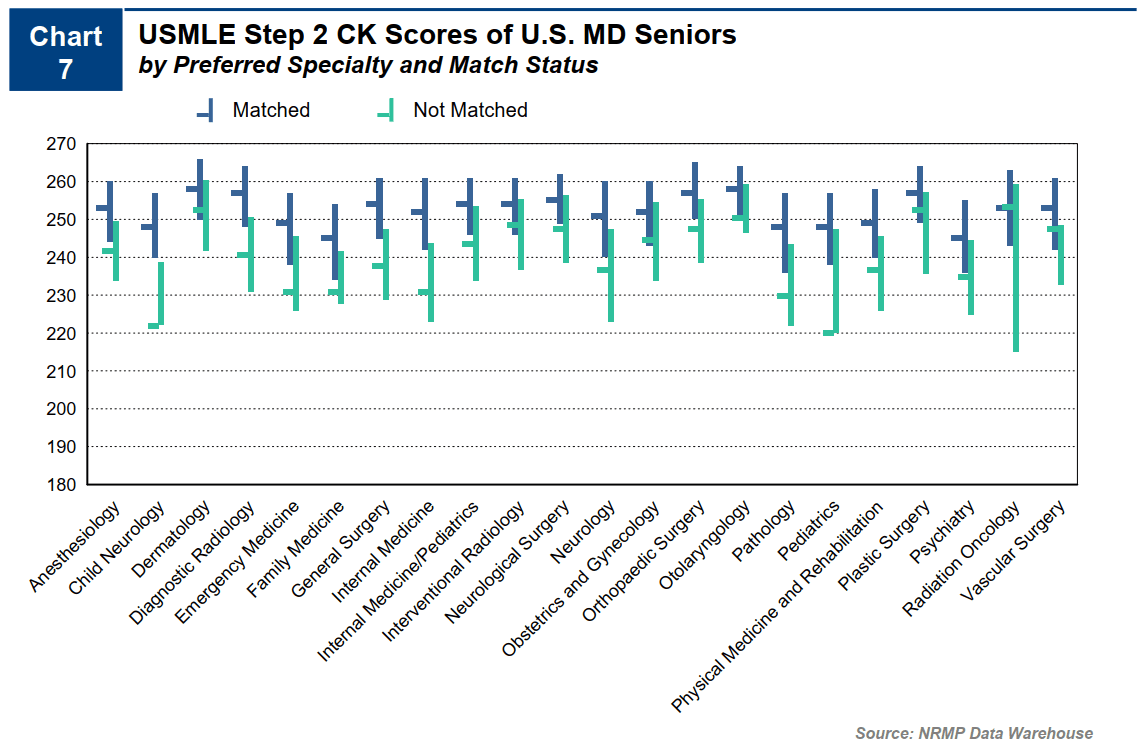
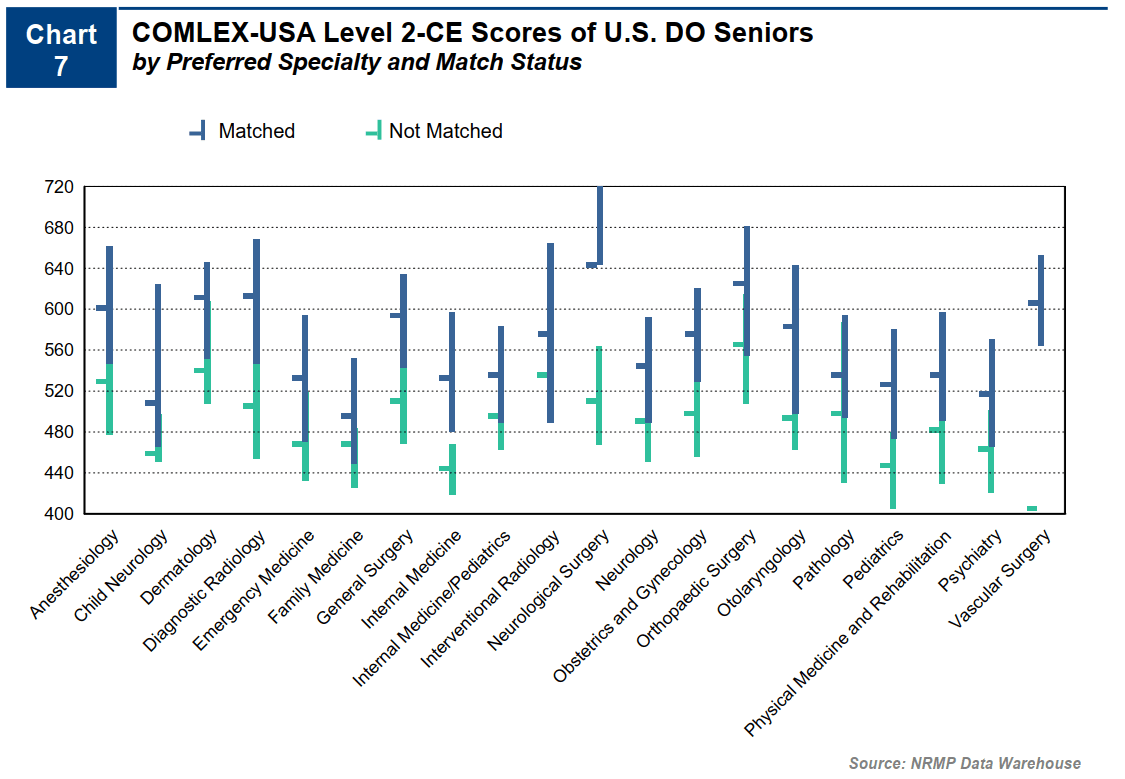
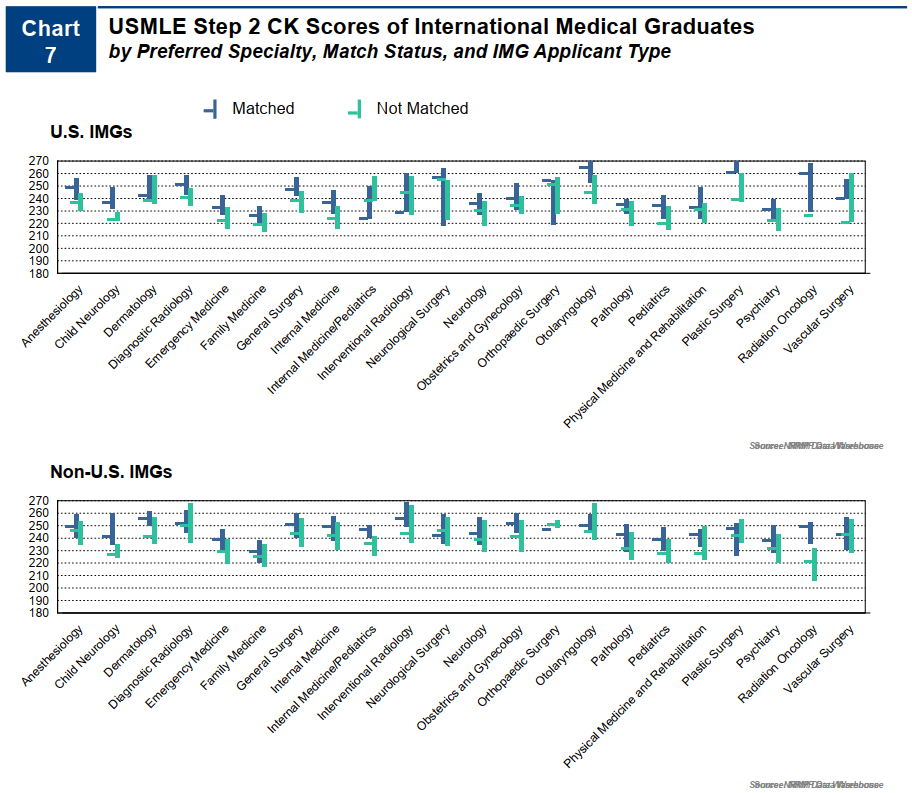
Shown below are three charts obtained from the NRMP (references are mentioned above). These charts show the median USMLE Step 2 score and the interquartile ranges for those who matched and did not match for each specialty. Importantly, this data only includes those applicants who matched into their preferred specialty (as described above), not all applicants. For most specialties across applicant types, the interquartile range of applicants who matched to their preferred specialty was higher than those who did not match.
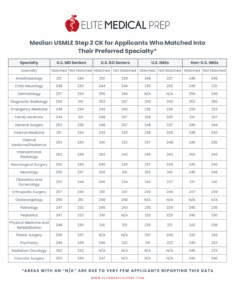
Here is a table listing all the median values shown in the aforementioned charts. When trying to determine what is a “good” USMLE Step 2 score, we recommend looking at this table. Find the specialty you are applying for, and try to aim for the score listed for those students who matched.
Median USMLE Step 2 CK for Applicants Who Matched Into Their Preferred Specialty*
The Most Competitive Specialties
Determining which specialties are the most competitive depends on how you define competitive. There is more than one way to define this term. However, most people gravitate towards the specialties with the highest USMLE scores. If we look at the top and bottom five most and least competitive specialties, respectively, we have the following data:
| Specialties with the highest and lowest median USMLE Step 2 CK scores | ||||
| U.S. MD Seniors | U.S. DO Seniors | U.S. IMGs | Non-U.S. IMGs | |
|
Highest Step 2 Scores
|
Dermatology | Neurological Surgery | Plastic Surgery |
Interventional Radiology
|
| Orthopedic Surgery | Interventional Radiology | Neurological Surgery | Dermatology | |
| Otolaryngology | Diagnostic Radiology | Diagnostic Radiology |
Diagnostic Radiology
|
|
| Plastic Surgery | Orthopedic Surgery | Anesthesiology |
Obstetrics and Gynecology
|
|
| Diagnostic Radiology | Anesthesiology | General Surgery | General Surgery | |
|
Lowest Step 2 Scores
|
Family Medicine | Psychiatry | Family Medicine | Family Medicine |
| Psychiatry | Internal Medicine/Pediatrics | Psychiatry |
Emergency Medicine
|
|
| Pathology | Physical Medicine and Rehabilitation | Pediatrics | Pediatrics | |
| Pediatrics | Pediatrics | Emergency Medicine | Psychiatry | |
| Child Neurology | Internal Medicine | Pathology | Pathology | |
When using Step 2 scores as a metric of competitiveness, we can see that Dermatology, Orthopedic Surgery, Diagnostic and Interventional Radiology, and Plastic Surgery tend to be some of the most competitive specialties. Pathology, Pediatrics, Psychiatry, Physical Medicine and Rehabilitation, and Family Medicine tend to be some of the less competitive specialties.
How Should I Use This Data?
Well, the first and arguably most important thing to take away from these data is that they are just ONE component of the residency application. While the USMLE Step 2 score is a critical component to your application, it is not the only one. Many programs take a holistic approach to your application. They consider multiple aspects of your application including test scores, clinical performance, letters of recommendation, academics, research, volunteering, etc. While a good Step 2 score is important, you need to also devote time to other components of your application.
When you are preparing for Step 2, we highly recommend aiming for a score at or above the median score for those who matched into your desired specialty. This is a quick and easy way to gauge what score you need to get to be competitive in this aspect of your application (we cannot stress enough that this is just one component!).
What Step 2 CK Score Do I Need to Secure Residency Interviews?
To boost your chances in the residency selection process, aim for a Step 2 CK score of at least 245. While a score of 245 generally places you at the 37th percentile, and is enough for some specialties, aiming for a score closer to the 75th percentile (around 260) is recommended. Scoring high on the Step 2 CK can have a major impact on residency interviews, especially now that Step 1 is pass/fail. High scores not only showcase clinical knowledge but also help make you a more competitive applicant.
Ready for Personalized Guidance?
Preparing for Step 2 is a multifaceted endeavor. Aiming for a competitive score is crucial, but it’s just one piece of the puzzle. For a comprehensive strategy tailored to your goals, consider scheduling a consultation. Our experienced tutors and residency advisors can provide expert insights on maximizing your Step 2 score and optimizing your residency application.
Schedule your complimentary consultation
Remember, success in your medical career is a journey, and we’re here to support you every step of the way. Let’s navigate this path together!
Featured Articles


